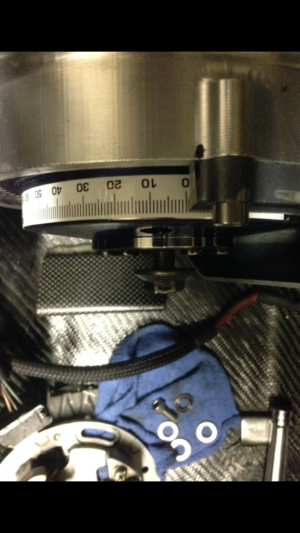
Is that using a non-stock flywheel?
@Storbeck No that flywheel is stock, #zero lightened the face & colored it.
@Storbeck, So I figured out why your timing curves look odd, couple small over sights
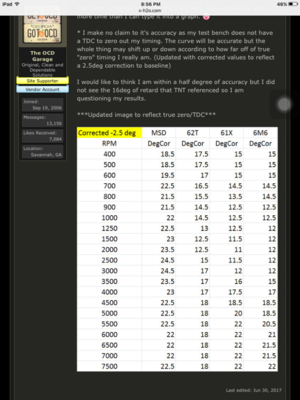
@The OCD Garage, Kutos to you for your work on that timing map, turns out it dam close to MSD published curve.
A little story first, for me it confirms the MSD published timing curve pick and OCD's map match.
Over the past 4 years or so I've had to adjust and trying a lot of timing curves, I found as little as a 2 deg change is a lot and can be felt riding the ski, so nearly any change you'd feel...
Super Long story short: So I put a TBM flywheel on my 8 mil stroker which had a MSD enhancer on it. Still ran great, Next I added a Epic hx3 with TBM flash and Airtimes timing curve. Ran like dog poop, couldn't even jump my own set up wake. I said maybe it's the curve, they said its my stator or my HT coil or my jetting. Problem started when I installed the hx3 so iam not agreeing. They were great to work with, I ask for the enhancer curve to rule out there curve, I program it and its still runs like poop. Chris calls me and we talk and he says put a stock flywheel on it and report. I put OE flywheel and bam skis running great again just like it did with the enhancer.. My point here is they gave me the published MSD timing curve, after the flywheel issue was fixed the ski ran like it had the enhancer installed... Curves felt the same.....
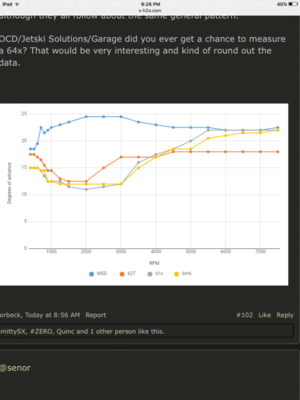
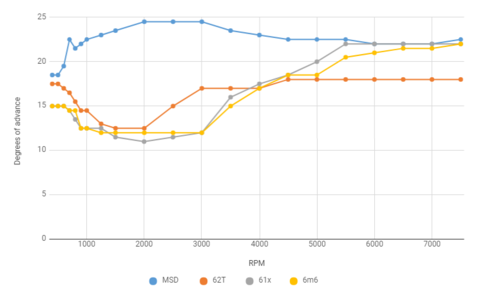
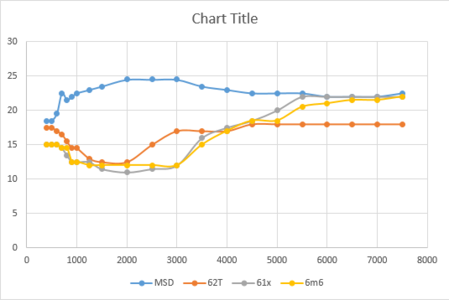
@Storbeck During my time testing cranking timing I found the engine cranking speed with plugs in started at 0 and increased to about 175 rpm. OCD chart starts at 400 rpm with 18.5 degrees of timing. Timing below 400 rpm is not listed. You plotted the 400 rpm timing info into the 0 rpm (start timing spot) and skewed all the maps. Little oversight, I prolly would have done the same dam thing.
OCD's 18.5 at 400 rpm nearly matches my published enhancer curves 400 rpm point, which is about 17.5... I found start timing about 12 deg on my engine cranking at 175 rpm.
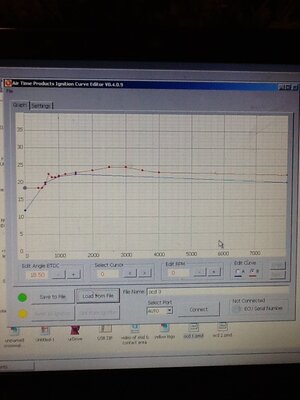
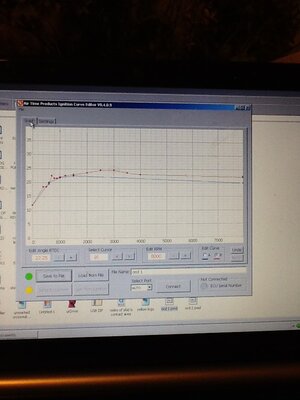
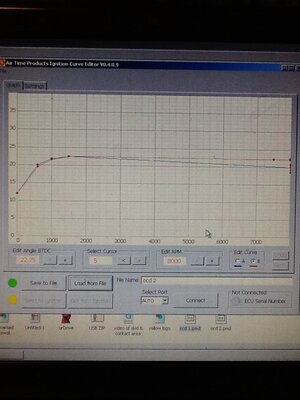
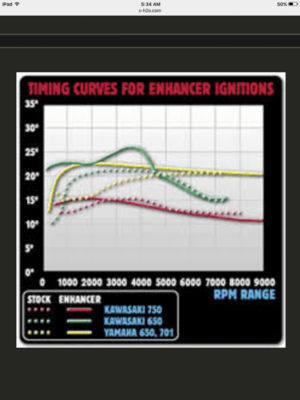
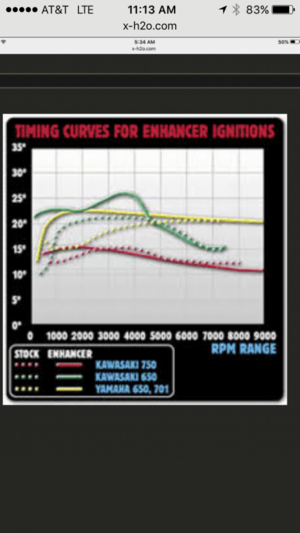
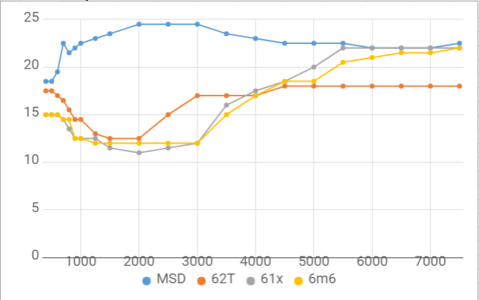
So I plotted OCD's chart 3 ways, first like you did and it looks the same as yours. Next I fixed the start timing portion and it looked a little better. Then I only drew the rpm data points Airtimes enhancer curve has, 0 to 600 to 1000 to 1500 End at 8k, let the program do the rest and whatda know its a dam near match, only off by +2.5 deg at 8k
OCD's map nearly concurs with MSD published map
Blue is MSD published, looks long because the graph is longer, not shrunk like msd's photo but is the same. Red is OCD's chart graphed for the 701 enhancer..
